The search for practical methods to represent and evaluate risk is undoubtedly a topic of methodological interest. In risk management, it is necessary to establish, through appropriate valuation metrics, the level of risk and its probability and impact components, as well as the concepts of risk appetite and tolerance. Over time, the valuation of these elements could change, just as the metrics adopted to value them could change or the enterprise’s risk propensity could change. The chosen method of risk representation must therefore be able to adapt to change with flexibility and simplicity.
Representing risk metrics in a way that is easily communicated and understood, while also satisfying the practical needs of calculating the level or aggregation of risk, requires the simultaneous management of qualitative and quantitative methods.Representing risk metrics in a way that is easily communicated and understood, while also satisfying the practical needs of calculating the level or aggregation of risk, requires the simultaneous management of qualitative and quantitative methods. The former facilitates communication with stakeholders, and the latter reduces the complexity of the valuation functions.
Definition of Risk
Risk assessment does not have a single recognized calculation method.1, 2, 3
Typically, the risk level is derived from a combination of a probability value of the event occurring and a measurement of the extent of the consequences (figure 1). This definition is easily represented with a matrix function that expresses the concept of risk as a relationship between the coordinates of the probability and impact values.
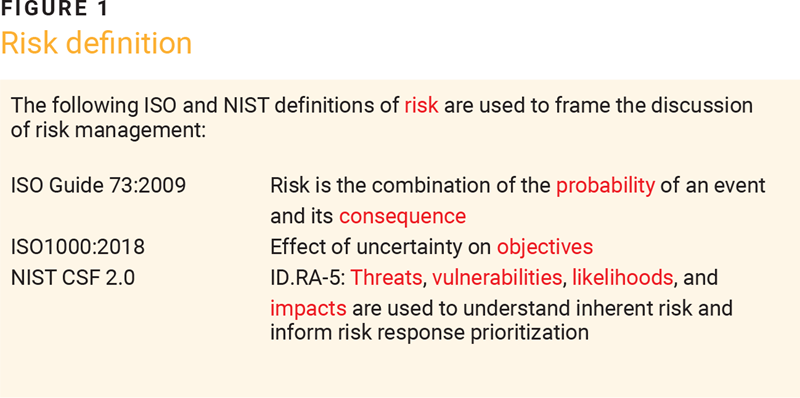
The following International Organization for Standardization (ISO) and US National Institute of Standards and Technology (NIST) definitions of risk are used to frame the discussion of risk management:
- ISO Guide 73:2009—Risk is the combination of the probability of an event and its consequence.
- ISO 31000:2018—Risk is the effect of uncertainty on objectives.
- NIST Cybersecurity Framework (CSF) 2.0—IDA. RA-5: Threats, vulnerabilities, likelihoods, and impacts are used to understand inherent risk and inform risk response prioritization.
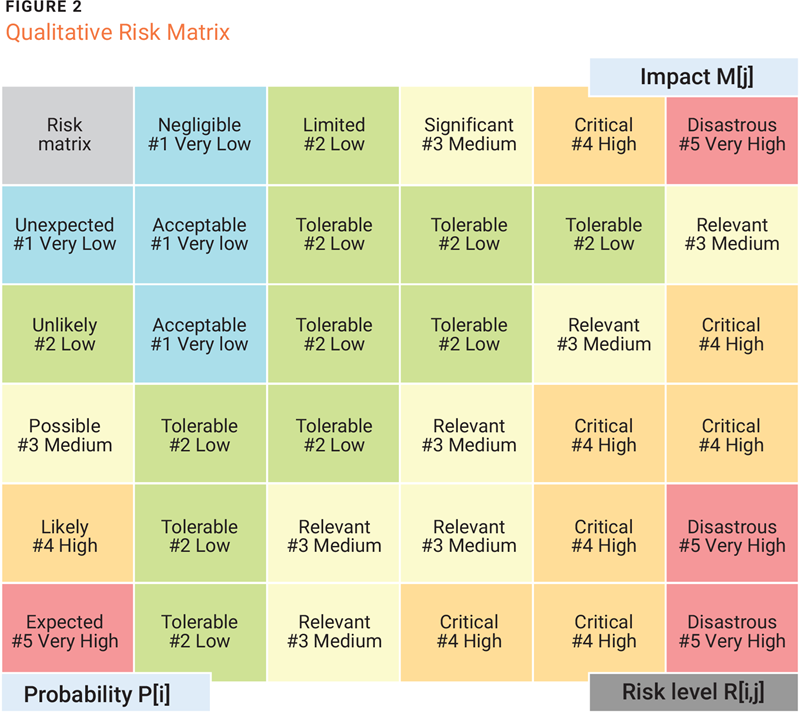
The use of a matrix is a simple and intuitive way to represent the risk assessment metric through both qualitative and numerical values. Although this simple representation does not necessarily meet all operational requirements immediately, it is a good starting point. The greatest difficulties are prioritizing and visualizing situations with a high number of identified risk levels compared to the risk defined in the chosen methodology.
To clarify these concepts, a typical 5×5 risk matrix, as shown in figure 2, is helpful. The five qualitative values of the probability of occurrence P[i] and the impact magnitude M[j] are distributed uniformly on the ordinate and abscissa. The risk level R[i, j] is identified by the corresponding crossing cell, and the set of values as a whole defines the enterprise’s risk appetite. The addition of colors to the labels creates a type of risk heat map, which makes it easier to read the corresponding levels. However, it is not an adequate solution for the prioritization of a large number of risk factors. The matrix operates with only 25 risk elements, but increasing the number of impact or probability levels could compromise its readability. Furthermore, because risk levels are established by senior management, designating a high number of elements to be managed manually inevitably results in difficult maintenance over time.
In the matrix, there is no evidence of a solid relationship to economic loss or a probability expressed in numerical form, to the detriment of a clear qualitative representation of the concept of risk appetite. For this reason, while leaving the number of qualitative levels unchanged, it is necessary to manage additional information to allow easy interaction between numerical and qualitative data and to ensure effective communication with senior management.
Determination of Impact Thresholds
It is often easier for senior management to express risk appetite in terms of the magnitude of economic loss than to choose a qualitative risk level. An approach that starts with senior management’s desire to avoid economic loss and then builds the risk matrix is intuitive and facilitates the link between numerical and qualitative information. This relationship is obtained by mapping senior management’s choices onto a normalized numerical domain that will be the reference for various mathematical calculations.
For normalization, the numerical domain {0, 1} is chosen to a two-decimal approximation. Theoretically, it is possible to operate with a greater number of decimals if there is a high number of identified risk factors, but this could hide a methodological weakness. Having many risk factors to manage does not help management’s decision-making ability, so it is preferable to aggregate the risk in multi-risk scenarios to reduce their number.
To interact with senior management, a table similar to figure 3 is used. The aim is to associate the ranking labels with a numerical value on which to develop the mathematical calculations. The figure can be used to determine an economic loss value for each level of impact. The lower threshold of the level must also be selected from three qualitative possibilities: adhering to the selected level, taking a median position, or adhering to the lower level. The enterprise’s maximum loss capacity must also be defined, which is normalized to 1. All economic loss values are normalized in proportion to the maximum value identified.
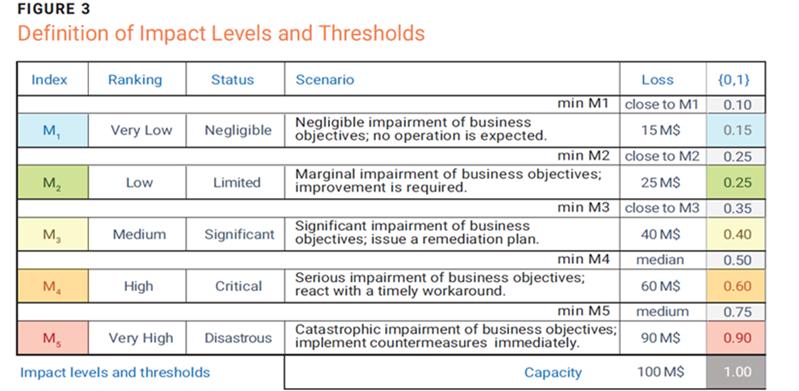
To simplify the explanation, suppose the enterprise has a maximum reaction capacity equal to a loss of US$100 million and that senior management has chosen the economic loss values reported in the “Loss” column. The lower threshold of the impact level is selected in the same column. Based on this information from senior management, the normalized and approximated values are automatically calculated with a step of 0.05. The choice of this step creates significant intervals between levels; it is possible that the risk practitioner could intervene manually to emphasize the distinction.
The final result is a link between qualitative values that are significant enough for senior management to express impact levels and the normalized values necessary for mathematical calculation.
Determination of Probability Thresholds
Constructing the metrics to manage the likelihood of a risk event also requires a determination of the probability thresholds, similar to the method for determining the impact. Senior management’s sensitivity to probability thresholds is not as cohesive as the concept of economic loss, but a similar scheme can be used to make these assessments (figure 4).
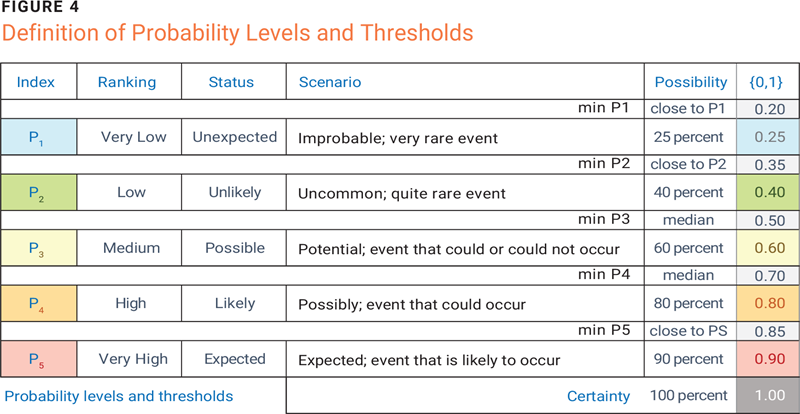
As with determining the impact, senior management expresses its concern about increasing the probability of an unwanted event. The “Ranking” column summarizes the likelihood of an event occurring by describing its occurrence and the extent of the possibility. It supports the selection of a probability level using growth percentages. Moreover, the selection of the lower threshold for the likelihood level needs to be qualitative, similar to the process used in impact determination. The chosen values are automatically normalized in the {0, 1} domain with a 0.05-step approximation.
In addition, as for impact, the number of elements evaluated in the probability determination is double the number of defined levels; for each level, the lower threshold is also defined. The selections by senior management are used for the automatic creation of a purely numerical matrix, both to allow mathematical calculation and to derive the qualitative risk matrix. This new matrix is referred to as the “intermediate matrix” to distinguish it from the initial risk matrix.
Construction of the Intermediate Matrix
The sequences of levels and thresholds established by senior management are distributed in preestablished positions in rows and columns of the intermediate matrix. Probability, impact, and the related thresholds are all approximated to the upper 0.05 value, while the corresponding risk levels obtained in the crossing cells—the numerical product of probability and impact—are expressed with an upper approximation of 0.01. The threshold values are distributed in the intermediate positions between two impact or probability levels and represented in the intermediate matrix in figure 5.
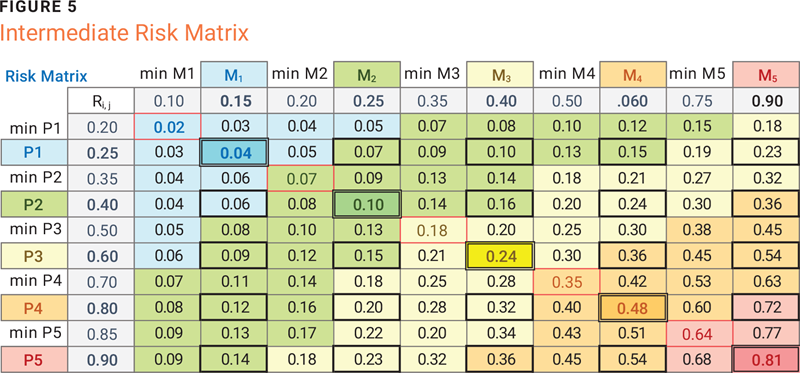
The diagonal of the intermediate matrix automatically identifies both the risk level metric and the risk tolerance. The diagonal cells with an odd index provide the minimum value of risk tolerance, while the cells with an even index provide the numerical value of the risk level to be associated with the qualitative one. The maximum value of each risk tolerance range is equal to the minimum value associated with the upper-risk level minus one-hundredth. Some characteristic properties of the matrix are:
- The value of R[2,2] is the level of risk acceptance.
- The range of values defined by R[1,1] and the value R[3,3] minus one-hundredth represents the tolerance values of the risk acceptance level.
- Values lower than R[1,1] are not considered a risk, and the related events are excluded from any further assessment if a trend is confirmed.
- The highest level of risk has a maximum tolerance value limit of 1, which represents the risk capacity.
In summary, the risk level and the minimum risk tolerance are automatically extracted from the intermediate matrix to create the table shown in figure 6. The maximum risk tolerance column is calculated using the minimum tolerance value associated with the next risk level minus one-hundredth. The intermediate matrix is not displayed to users but is kept in the system’s memory to allow the transformation of probability and impact into risk and to illustrate the relationships between qualitative and numerical values.
Note for database use: In the calculation, the risk value is numerical while its level is qualitative. The transition from value to level is through risk tolerance. For example, in figure 6, a risk value of 0.13 is a risk level of 2, since it is in the 0.07 to 0.17 range.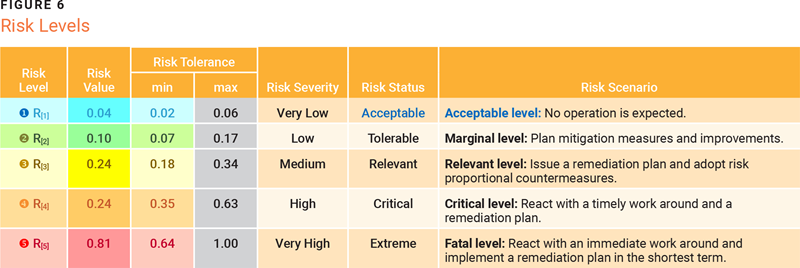
In the Structured Query Language (SQL) environment, it is simple to manage multiple risk matrices at the same time. The single matrix is represented by a table where the entire Cartesian product of the possible impact and probability values is developed. Each row will have the pair of impact and probability values as a key, while the attributes will be the level and value of the risk derived from the intermediate matrix. This transforms the matrix into a table format.
A single select statement can extract the risk level (or its value) by approximating the probability and impact to their lowest value in the table. To use different risk matrices for specific situations, this SQL solution simply requires adding two additional columns, the risk level and risk value, for each additional risk matrix.
The technique proposed for database use can also be exploited to change the risk appetite when certain situations occur automatically. For example, some risk events may require the use of a more aggressive matrix (or a more conservative one), as the cybersecurity protection objective varies. With the confidentiality, integrity, and availability (CIA) security triad representing the desired security objective,2 it would be possible to decide that when at least two parameters exceed the average value of the triad, a matrix with a more conservative risk would be necessary. Conversely, if all three parameters of the triad fall below the average value, the risk matrix would have to be more aggressive.
The technique for managing the change of the intermediate risk matrix requires preparing a more conservative and aggressive matrix in the SQL environment. A SQL function, based on the security triad of the risk scenario to be evaluated, acts as a selector of the column representing the intermediate matrix established for that protection objective. This is hidden from the user and is entirely automatic. It should not be necessary to vary the probability or impact.
Conclusion
Senior management tends to be more comfortable with the concept of impact (an imaginable consequence) than the concept of risk (a possible event). Consequently, the impact and probability of the occurrence of a risk event can be used separately to build a risk assessment mechanism, with all the parameters necessary to provide a clear description of the risk level. A numerical (intermediate) matrix is derived from senior management’s consideration of probability and impact. The use of this numerical matrix transforms qualitative data into numeric data, or vice versa, and facilitates the calculations necessary to aggregate or prioritize risk.
It is possible to collect the elements necessary to express the concepts of risk appetite and tolerance in a way that is intuitive for senior management. At the same time, many elements can be designated, shown as cells of the matrix, to differentiate risk events from one another and prioritize them. The sorting acts first on the level of risk and then on the impact and probability or a mix between the two. This ensures the availability of a simple method to keep the risk assessment system efficient over time.
It is possible to immediately verify that the assessment was derived from the intermediate matrix by considering all the cells that have even indices for both impact and probability. The qualitative risk matrix represents the means to communicate effectively with stakeholders, while the intermediate matrix communicates with the calculation systems. The main advantage of this methodology is the ease of maintenance of the risk parameters without the loss of the numerical sensitivity critical to the calculation. The result is a good compromise between the various needs of the risk management system.
The main advantage of this methodology is the ease of maintenance of the risk parameters without the loss of the numerical sensitivity critical to the calculation. The result is a good compromise between the various needs of the risk management system.
Endnotes
1 International Organization for Standardization (ISO), ISO 31073 Risk management—Vocabulary, 2022
2 International Organization for Standardization (ISO), ISO/IEC Guide 73:2002 Risk management—Vocabulary, 2002
3 US National Institute of Standards and Technology (NIST), Cybersecurity Framework CSF 2.0 Reference Tool, Subcategory ID.RA-05
4 ISACA® Information Security”
LUIGI SBRIZ | CISM, CRISC, CDPSE, ISO/IEC 27001:2013 LA, ITIL V4, NIST CSF, UNI 11697:2017 DPO
Is a lead auditor, trainer, and senior consultant on risk management, cybersecurity, and privacy issues. He was responsible for risk monitoring at a multinational automotive company for more than seven years. Previously, he was head of ICT’s operations and resources in the APAC Region (China, Japan, and Malaysia), and before that he was the worldwide information security officer. He developed an original risk-monitoring methodology that integrates operational risk analysis, control maturity level assessment, and risk-based internal audit and treats business processes as cooperating services based on the guiding principles of the ITIL 4 framework and the Agile Manifesto. He also designed a cybermonitoring tool based on OSINT and proposed a digital identity authentication standard. Sbriz was a consultant for business intelligence systems for several years. He can be contacted via LinkedIn at https://www.linkedin.com/in/luigisbriz or at http://sbriz.tel.