
Introduction
Every day, organizations make decisions about where to spend limited time, resources, and attention. In cybersecurity, these trade-offs often leave behind something hidden but increasingly costly: security debt. Security debt represents the accumulated risk created by outdated systems, deferred remediation, unpatched vulnerabilities, and underresourced programs. Much like technical debt (the cost of quick fixes over long-term stability), security debt reflects the exposure that grows when speed, innovation, or convenience outpace security.
Security debt represents the accumulated risk created by outdated systems, deferred remediation, unpatched vulnerabilities, and underresourced programs. Much like technical debt (the cost of quick fixes over long-term stability), security debt reflects the exposure that grows when speed, innovation, or convenience outpace security.Security debt is tied directly to business risk. It threatens confidentiality, integrity, and availability while eroding trust among customers, partners, and regulators. Today’s digital ecosystem—with the accelerated pace of cloud adoption, artificial intelligence (AI), and compliance obligations—only amplifies this risk. Across industries, for example, AI models are deployed before governance catches up, introducing bias or leaking data and proprietary information. Shadow IT also thrives in the gaps, as teams add tools and integrations faster than security can track them. As organizations modernize and interconnect systems, attack surfaces and accountability surfaces will only continue to expand.
Security debt is a reflection of how decisions, priorities, and culture shape an organization’s ability to manage risk. When left unmanaged, it is a blind spot that drives breaches, erodes trust, and limits an organization’s ability to adapt and innovate securely. Security debt is just one of many security risk factors, but it is an important consideration for enterprises that value speed and innovation. This paper explores the causes, impacts, and strategies to identify, measure, and reduce security debt across technology, culture, and governance. Its goal is to equip leaders with a structured framework that treats debt as a tangible business liability that demands executive attention and shared accountability.
Understanding Security Debt
Security comprises many factors, one of which is security debt. Because of a desire to move quickly and adopt the newest tools and technology, many enterprises inadvertently accrue security debt. When left unresolved, this debt can have serious consequences for enterprises.
Concept Origins
American computer programmer Ward Cunningham first introduced the concept of technical debt in 1992, comparing rushed software work to taking on a financial loan: it speeds delivery now but creates long-term costs related to maintenance and performance.1 The analogy was later expanded beyond code into architecture, process, and design.2
Security debt has emerged as a natural extension. Unlike technical debt, which affects efficiency, security debt directly increases exposure to threat activity, compliance gaps, and loss of trust. These gradually weaken confidence in the systems designed to protect the business. When organizations postpone essential security work, such as patching, control updates, access reviews, or redesigns, a major disruption can bring these vulnerabilities to light.
Types of Security Debt
Security debt forms across technology, people, and culture. Broadly, it falls into four categories: technical and process debt; business, leadership, and cultural debt; modernization and innovation debt; and governance debt.
Technical and Process Debt
Technical and process debt refers to aging systems, manual processes, and inconsistent patch cycles. In some cases, it may also come from workarounds that enable enterprises to move quickly instead of implementing future-ready and stable solutions. If patching cycles lag or vulnerability management falls behind, gaps may emerge that can become entry points for attackers. These gaps create the “interest” that organizations pay on deferred maintenance. Over time, these issues can erode an organization’s defenses, leading to breaches. For example, according to IBM’s 2025 Cost of a Data Breach Report, organizations with slower containment cycles face significantly higher breach costs.3
Business, Leadership, and Cultural Debt
Security debt can also originate with leadership, such as executive management and the board of directors, who set the tone of an enterprise’s culture. For instance, when cybersecurity is treated as a project instead of a shared responsibility, this can create a lack of accountability across the organization. Often, in these cases, budgets are deferred, governance is inefficient, and awareness training is neglected. Budget and resource allocation may also lead to this type of debt. Culture is important as well; when teams assume “someone else will handle it,” resilience may be impacted.
When cybersecurity is treated as a project instead of a shared responsibility, this can create a lack of accountability across the organization.Modernization and Innovation Debt
Modernization debt occurs when enterprises keep legacy systems running without updating them to state-of-the-art, modern systems and applications. Innovation debt is similar, but it relates more to a failure to adopt emerging technologies that improve and create efficiency.
Governance Debt
Governance only works when the right people understand, support, and act on enterprise policies, which stresses the importance of engagement from security, compliance, legal, procurement, and leadership. However, in many enterprises, innovation outpaces governance, resulting in governance-related debt. When new systems launch without the right guardrails and oversight, for example, they introduce invisible layers of exposure. Industry research consistently links mature governance and board-level cyberoversight with reduced breach impact, including lower breach costs and faster detection and containment as compared to less mature organizations.4
Key Drivers of Security Debt
Every organization’s version of security debt looks different, but the reasons it forms are remarkably consistent. These include:
- Legacy systems and outdated technology—Old technology, such as unsupported platforms, aging code, and proprietary tools, frequently cannot evolve with the business. Without clear ownership and a plan to retire them, legacy systems can become liabilities.
- Budget constraints and prioritization—When budgets tighten or new projects take priority, critical security upgrades may be pushed off. These deferrals might seem harmless at first, but small, repeated compromises can accumulate over time and create systemic risk.
- Digital transformation—Transformation brings opportunity as well as pressure. As organizations move workloads to the cloud or embed AI into daily operations, controls do not always keep up. AI, in particular, is both a force multiplier and a new frontier: when governed well, it enhances detection and response effectiveness, contributing to reduced breach impact and cost. According to IBM, in 2025, organizations that used AI and automation saved an average of US$1.9 million in breach-related costs.5 However, without oversight, AI can also expose sensitive data, introduce bias, or demonstrate unintended behavior.6
- Shadow IT and unmanaged tools—Shadow IT remains one of the most persistent and overlooked sources of security debt. It happens when teams adopt tools or integrations outside of approved channels and can lead to a patchwork of systems with unevenly applied security controls and limited visibility across environments. With time, untracked data, reused credentials, and unmanaged connections caused by shadow IT may create blind spots that result in data loss, compliance violations, or cyberincidents.
Life Cycle of Security Debt
Security debt develops slowly, decision by decision, with each skipped patch, delayed audit, or unchecked configuration adding another layer of risk. These layers compound until the organization hits a tipping point, such as a breach, audit finding, or compliance violation. Breaches that are identified and contained quickly tend to be less costly.7 The normal life cycle of security debt is shown in figure 1.
Figure 1: The Security Debt Life Cycle
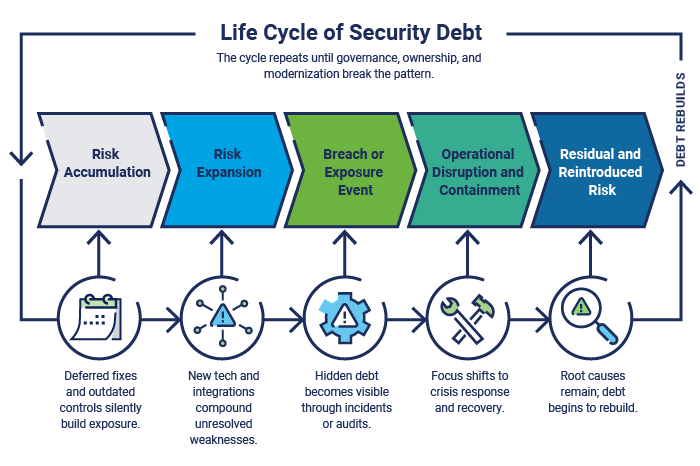
When a tipping point is reached, the focus shifts from prevention to containment. Teams might scramble to isolate systems, restore services, and explain incidents. This reactive cycle drains time, budget, and credibility. In this context, breaking the cycle requires deliberate governance actions, such as clarifying ownership and strengthening accountability before the next decision, implementation cycle, or security incident occurs.
Security Debt Examples
The following examples show how seemingly minor decisions can have serious consequences for enterprises.
Unpatched Systems
Few examples illustrate security debt better than unpatched systems. Every missed update represents a known risk that has gone unaddressed, usually to avoid downtime or cost.
The 2017 Equifax data breach remains a defining case. A critical Apache Struts vulnerability had been identified, a patch was released, and alerts were issued to the company. However, the update was never applied to Equifax’s systems. Months later, attackers used that flaw to steal the personal data of more than 140 million people.8 What began as a simple maintenance delay became one of the most expensive breaches in history, costing at least US$575 million and years of trust to rebuild.9
Weak Identity and Access Management
Weak identity and access management (IAM), such as shared credentials, excessive privileges, lack of credential rotation and monitoring, and poor multifactor authentication (MFA) enforcement, can lead to security debt. In the 2024 Change Healthcare ransomware attack,10 for example, investigators found that inconsistent use of MFA provided an easy entry point, mirroring the same weaknesses outlined in the federal #StopRansomware advisory.11 Within days, ransomware spread across critical systems, halting billing and prescriptions nationwide. The ripple effect was staggering: providers could not pay staff or operate, and some even took out personal loans to stay open.12 The lesson is that security debt can not only impact operations but also human beings.
Siloed Monitoring and Alerting
The average timeline to identify and contain a breach is 241 days (figure 2),13 proof that security debt related to insufficient monitoring is persistent. Even the most advanced tools can fail when data and alerts are trapped in silos and visibility is weak. Fragmented monitoring between business units, cloud providers, or third-party security operations centers (SOCs) can miss early indicators of malicious activity or compromise. Take the 2020 SolarWinds supply chain breach as an example. Attackers inserted malicious code into a trusted software update, compromising thousands of organizations, from government agencies to Fortune 500 companies.14 The breach went undetected for months and was ultimately discovered by another vendor investigating unrelated anomalies.15 This incident shows that visibility requires integration.
Figure 2: Average Time to Identify and Contain a Data Breach16
| Year | Identify (Days) | Contain (Days) | Total Life Cycle (Days) |
|---|---|---|---|
|
2020 |
207 |
73 |
280 |
|
2021 |
212 |
75 |
287 |
|
2022 |
207 |
70 |
277 |
|
2023 |
204 |
73 |
277 |
|
2024 |
194 |
64 |
258 |
|
2025 |
181 |
60 |
241 |
Gaps in Governance and Oversight
Governance gaps, including unclear ownership, weak accountability, and insufficient frameworks, create risk, as demonstrated by the 2023 MOVEit breach. In this instance, the Progress Software file transfer tool (known as MOVEit Transfer) was compromised by the CL0P Ransomware Gang,17 and thousands of organizations across healthcare, government, and finance were affected.18 The vendor (Progress Software) released a patch quickly, but many affected enterprises were service providers to other enterprises, making remediation complex.19
Governance gaps, including unclear ownership, weak accountability, and insufficient frameworks, create risk.Impacts of Security Debt
Security debt creates operational, financial, reputational, and strategic impacts.
Operational Impacts
At its core, security debt makes organizations slower and more fragile. Every unpatched system or missing control adds drag to daily operations, which multiplies during a crisis. According to IBM’s 2025 Cost of a Data Breach Report, 86% of breached organizations experienced operational disruption, with activities such as processing orders impacted in the aftermath.
Security debt can also affect agility. Teams working with outdated technology or manual processes have less bandwidth to innovate or strengthen defenses. The constant catch-up cycle can cause human fatigue, and fatigue can lead to mistakes.
Financial Impacts
The financial cost of security debt impacts projects, audits, and operations. It can manifest as delayed timelines, higher insurance premiums, or rework from teams forced to fix same issues repeatedly. In 2025, the global average cost of a breach was US$4.44 million; regulatory fines and detection and escalation costs were driving factors.20 Other examples of financial impacts include deferred maintenance that leads to compliance penalties, outdated systems that raise recovery costs, and shaken customer confidence that negatively impacts revenue.
In 2025, the global average cost of a breach was US$4.44 million; regulatory fines and detection and escalation costs were driving factors.Reputational Impacts
When trust is impacted due to a breach, it affects overall public perception. Customers, investors, and regulators might expect lessons to be learned and applied. In addition, breaches tied to known vulnerabilities or long-ignored risk may do more damage to credibility than novel attacks. This reputational cost can last long after technical remediation, driving customer attrition and leadership turnover.
Strategic Impacts
Strategically, security debt limits decision making and forces leaders to plan around limitations instead of possibilities. When systems are unreliable, for instance, innovation may stall and leaders may hesitate to launch new initiatives, with strategic goals shrinking to fit operational realities. Security debt also changes how success is measured. Instead of tracking growth or transformation, leadership ends up tracking incidents, constraints, and exceptions. However, organizations can confront security debt early by aligning debt reduction to business objectives and embedding it into planning cycles.
Security debt rarely damages only one facet of an organization. Each impact can compound with the next—for example, an operational disruption becomes financial loss, reputational damage, and a strategic slowdown (figure 3).
Figure 3: The Compounding Impacts of Security Debt
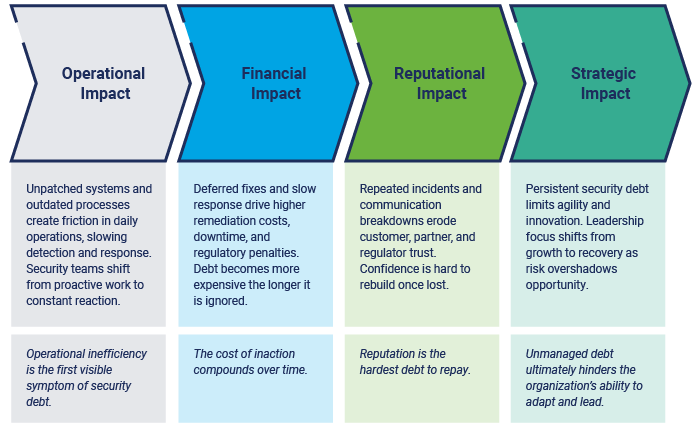
Recognizing the various impacts is the first step; the next challenge is visibility, which involves knowing where security debt exists and how to track progress toward reducing it.
Security Debt Curve
Security debt does not grow in a straight line. Early on, risk accumulates slowly, and teams might delay upgrades, accept exceptions, or postpone fixes with little visible fallout. But as systems become more interconnected and complexity increases, the slope becomes steeper. Teams then spend more time reacting to issues, resulting in fixes costing more, taking longer, and delivering less value to the enterprise. By the time the curve reaches its steepest point, debt has evolved beyond technology and is now organizational. This pattern is what defines the Security Debt Curve (shown in figure 4).
Figure 4: The Security Debt Curve
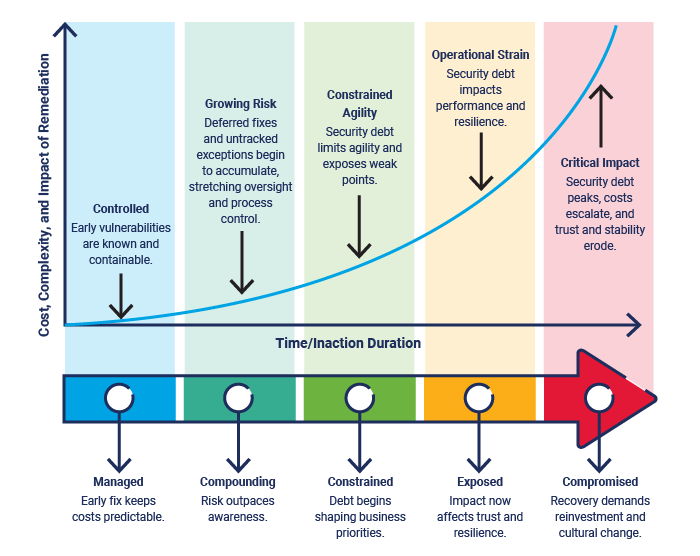
Understanding the curve gives leaders a new lens for viewing risk. Addressing debt early keeps the curve shallow, where action is still affordable and disruption is contained. Deferred action lets that slope grow steeper, with every delay multiplying cost, complexity, and exposure.
Addressing debt early keeps the curve shallow, where action is still affordable and disruption is contained. Deferred action lets that slope grow steeper, with every delay multiplying cost, complexity, and exposure.The Security Debt Curve illustrates how the longer debt remains unresolved, the more it strains an organization’s agility, resources, and trust.
Identifying, Measuring, and Managing Security Debt
Identifying security debt is one of the hardest challenges for security and business leaders. Even with strong risk registers or vulnerability data, many organizations struggle to connect isolated findings to a full picture of cumulative exposure. Without that visibility, it is nearly impossible to see where debt is growing the fastest or which risk matters most.
Figure 5 frames identifying security debt as a continuous cycle rather than a one-time exercise. Debt builds, shifts, and compounds over time, which means organizations are constantly monitoring signals, identifying where exposure is growing, assessing impact, measuring progress, and managing trade-offs.
Figure 5: Security Debt Assessment and Indicators Cycle
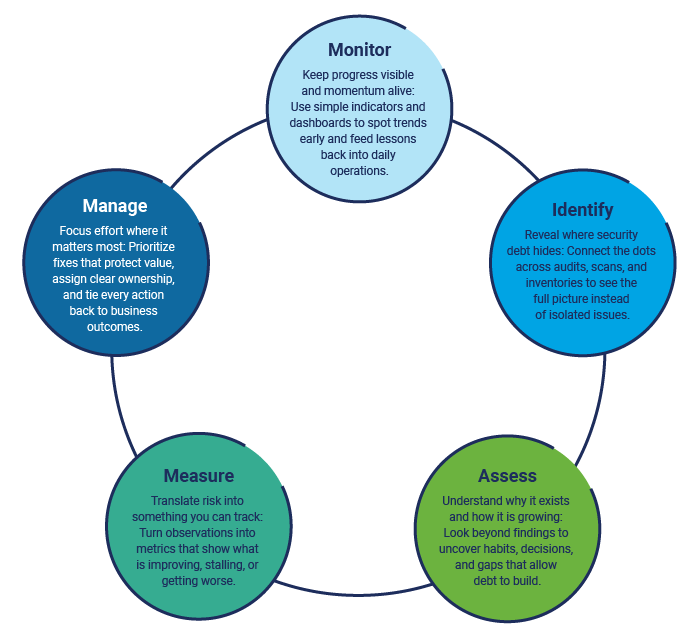
Most organizations already have the data they need to identify security debt: scans, audits, inventories, and reports. The challenge lies in connecting those signals into a single, coherent story. Structured assessments bring that story into focus, revealing not only what is at risk, but also why the debt exists and where it continues to grow.
Assessment Methods
The goal of assessment is to build a repeatable way to see where risk collects. A strong approach blends technical insight, governance awareness, and business context. Assessment methods include:
- Start with existing data—Pull together vulnerability scans, audit results, asset inventories, and system logs into a unified view. This can be done through dashboards, reporting layers, or correlation workflows that bring multiple data sources together around common identifiers such as the system, application, owner, or business function. Look for patterns such as recurring findings, lingering exceptions, and systems that repeatedly fall outside of patch cycles.
- Layer governance and process assessments—Evaluate process gaps (not just technical ones). Review where ownership is unclear, exceptions remain open, or risk decisions stall due to lack of context. Governance maturity reviews and audit closure rates often expose how process gaps allow debt to persist.
- Examine decision culture and workflow habits—Evaluate what decisions and actions are prioritized or delayed and how exceptions are handled. Mapping where these choices occur can reveal unknown contributors to security debt.
- Align risk reduction to business impact—Not all debt carries equal weight. Focus on the areas tied to critical operations, regulated data, or customer-facing systems. Mapping technical backlog to operational, regulatory, and reputational outcomes turns risk reduction into a business-driven priority.
- Track maturity and progress—Debt changes, and so should an organization’s visibility. Establish regular measurement intervals to track whether debt is growing or shrinking. Use maturity scoring and trend analysis to demonstrate accountability and guide future investments.
These assessments help construct a living map of where attention needs to shift.
Security Debt Indicators
Once debt is identified, the next step is to interpret it. Indicators serve as directional signals, pointing to areas of concern. Good indicators do three things: show movement, connect to priorities, and help leaders focus on what requires accountability or investment. The following are practical indicators for tracking debt across different parts of an organization.
Indicators serve as directional signals, pointing to areas of concern. Good indicators do three things: show movement, connect to priorities, and help leaders focus on what requires accountability or investment.Technical Indicators
Metrics that reveal where risk collects in systems and infrastructure include:
- Patch latency—Average time to close known vulnerabilities
- Unsupported systems—Percentage of assets running past end-of-life
- Vulnerability recurrence—Issues that reappear after closure
- Asset visibility gaps—Endpoints or systems missing from inventory21
- Configuration drift—Deviations from approved baselines
Governance and Process Indicators
Signals that show where accountability or structure may be weakening include:
- Repetitive audit findings—Recurring issues that point to deeper gaps
- Risk exception volume and duration—How many exist and how long they stay open
- Policy coverage and update frequency—Policies that have not kept pace with new standards
- Control effectiveness trends—Declining or stagnant test results
Emerging Technology Indicators
Metrics that capture how new innovations introduce unseen risk include:
- Shadow IT volume—Number of unapproved or untracked applications in use22
- AI tool governance—AI systems lacking oversight, inventory, or policy coverage
- Cloud configuration drift—Baseline deviations across cloud environments
- Third-party integration risk—External connections lacking validation or safeguards
Business and Impact Indicators
Measurements that tie security debt to real business consequences include:
- Incident frequency and severity—Events tied to known or deferred risk
- Downtime or service degradation—Disruptions from aging systems
- Regulatory findings or fines—Compliance penalties from unaddressed risk
- Insurance cost trends—Changes in premiums that reflect security maturity
- Time to recover or restore—Duration of recovery from debt-related impacts
Making Indicators Actionable
To make indicators actionable, organizations can select 10 to 15 that align with their most crucial goals. It is important to give each indicator a clear owner, a review cadence, and a direct connection to a business outcome. Gradually, trends will emerge, showing where debt is compounding, shrinking, or responding to investment. When indicators are defined, measured, reviewed consistently, and visible to the right stakeholders, they can track performance and help leaders make proactive decisions.
Measuring and Quantifying Security Debt
Indicators show where security debt exists, while measurement explains how it “behaves” over time. Measuring security debt is about understanding the scale, speed, and impact of the debt. Done well, measurement turns debt into something that can be trended, prioritized, and managed like any other form of risk.
Security Debt Index
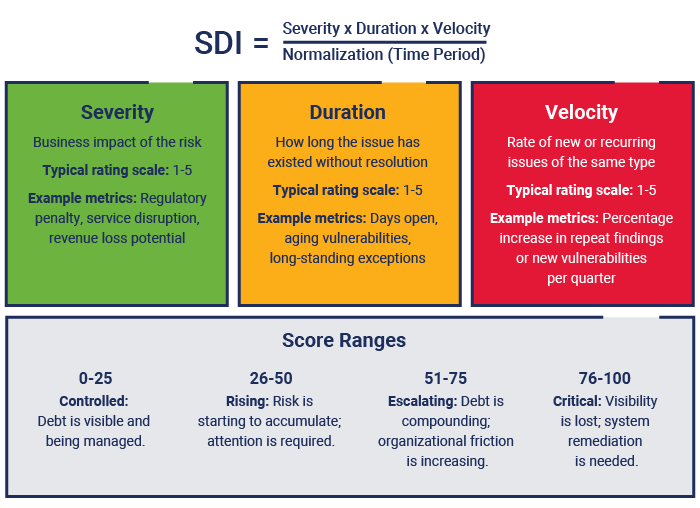
The Security Debt Index (SDI) model considers these three dimensions:
- Severity—The business impact of each issue
- Duration—How long the debt has remained unresolved
- Velocity—How quickly new issues of the same type appear
Each dimension is scored using a normalized scale (e.g., 1-5) based on the criteria defined by the organization. These scores are then combined to form the SDI (figure 6). This is a composite score that tracks whether the organization’s overall debt posture is improving or worsening. Rather than replacing existing risk ratings, SDI provides a way to track debt—a rising SDI signals that issues are compounding faster than they are being resolved, while a declining SDI indicates that remediation efforts are reducing both exposure and backlog.
Figure 6: Security Debt Index (SDI) Model
For example, a vulnerability affecting a customer-facing system may score high for severity due to business impact. If it has remained open for several months, its duration score increases. If similar vulnerabilities continue to appear across the same platform, velocity rises as well. Even if each issue appears manageable on its own, the combined SDI highlights when unresolved risk is compounding and therefore requires consideration.
The most meaningful insights come from patterns, such as the number of issues closed versus discovered, the average age of open findings, or how quickly critical vulnerabilities are resolved. These patterns show where effort is paying off, where momentum is stalling, and where leadership attention can make the biggest difference.
The most meaningful insights come from patterns, such as the number of issues closed versus discovered, the average age of open findings, or how quickly critical vulnerabilities are resolved. These patterns show where effort is paying off, where momentum is stalling, and where leadership attention can make the biggest difference.When used consistently, SDI allows organizations to compare debt trends across systems, teams, or time periods and to prioritize remediation where risk is both material and accelerating. SDI scores are not intended to be precise measurements, but directional indicators that support comparison and decision making.
Managing and Reducing Security Debt
Reducing security debt should focus on managing what matters most, specifically the risk factors that carry the greatest business impact, regulatory exposure, or operational consequence. The goal is deliberate progress and aligning security, technology, and business priorities so that risk is reduced with intent instead of urgency.
Risk Register
Including security debt in the risk register can help organizations track debt, maintaining visibility throughout the process. Each entry should include the issue, its owner, and the impact if left unaddressed, along with the estimated time, effort, and cost to fix it. Updated consistently, this helps encourage accountability. It can also be a practical tool for communicating progress with leadership, regulators, and partners.
Methods to Reduce Security Debt
Two valuable practices for reducing security debt are incorporating security into DevOps and adopting a zero trust mindset.
In DevOps, automation and speed sometimes surpass controls. Security should be embedded into DevOps, and developers should write code with security in mind. Embedding validation directly into delivery through automated testing, configuration checks, and access reviews prevents vulnerabilities from entering production.
Zero trust addresses both new and inherited risk by shifting the underlying security mindset. Rather than assuming trust based on network location, role, or past access decisions, a zero trust approach treats access as something that must be continuously evaluated and revalidated.23 Methods such as verifying identity and enforcing least privilege help expose and reduce vulnerabilities, shrinking the number of attack paths.
Together, security-focused DevOps and zero trust practices create a delivery rhythm where speed, safety, and accountability coexist.
Compliance and Regulatory Frameworks
Frameworks and regulations, such as the Payment Card Industry Data Security Standard (PCI DSS) 4.0, Health Insurance Portability and Accountability Act (HIPAA), Health Information Trust Alliance (HITRUST) Common Security Framework (CSF), and National Institute of Standards and Technology (NIST) Cybersecurity Framework 2.0, can provide structure for compliance activities that prevent or reduce security debt. This may include documentation, control testing, and audits. Regular tests and audits, for example, can highlight where risk keeps resurfacing within the organization. The key is moving from “check-the-box” compliance to operational compliance, where policies and controls are embedded into daily processes, consistently applied, and reinforced through ownership. In addition, adopting frameworks can help demonstrate accountability, maturity, and measurable improvement.
Governance Integrations
Governance turns debt management into a continuous practice. Integrating tracking, ownership, and reporting into governance routines (such as risk reviews, architecture and change forums, audit follow-ups, and leadership reporting) helps make accountability a part of daily operations.
As mentioned, modern environments demand adaptive governance. Cloud, AI, and data platforms create risk that traditional controls do not always address, so it is important to expand governance to cover these systems. This is done by defining security and compliance as automated controls within the continuous integration/continuous delivery (CI/CD) pipeline, i.e., policy as code.
Cloud, AI, and data platforms create risk that traditional controls do not always address, so it is important to expand governance to cover these systems.Prioritization
When it comes to reducing security debt, the 80/20 principle holds true: most risk stems from a small set of recurring issues, and addressing those few areas delivers the greatest impact. Prioritization helps identify what to focus on, while technical strategies such as automation and modernization make that focus sustainable.
Automation supports prioritization by handling routing work, such as patching, inventory updates, and configuration checks, so that teams can focus on recurring high-impact risk. Modernization reinforces this effort by retiring legacy systems, consolidating tools, and standardizing configurations, which reduces complexity and shrinks attack surfaces.
Risk Trade-Offs: When to Accept, Transfer, or Mitigate
No organization can eliminate all security debt. It is crucial to know which risk to act on, delay, or share. Some best practices include:
- Mitigate risk when exposure threatens operations, compliance, or trust.
- Transfer risk through insurance, managed services, or shared responsibility models when third parties can better absorb the burden.
- Accept risk when the cost or effort outweighs the impacts; keep accepted debt visible with clear ownership and regular reviews.
Framing these choices in business terms turns trade-offs into strategy and balances cost and risk in a way that leadership can support.
Explaining Security Debt to Leadership
Leadership needs clarity and context rather than technical detail. Security debt should be framed in business terms, showing how it affects revenue, operations, and customer confidence. When technical issues are tied to outcomes like reputation, they are more easily recognized as business priorities. For instance, an outdated payment system is not just legacy technology; it is a PCI compliance gap. Weak access controls are not just configuration misses; they are potential service disruptions.
Security debt should be framed in business terms, showing how it affects revenue, operations, and customer confidence.Simple metrics should be communicated to leadership, such as the number of unsupported systems, the average age of findings, or the cost to remediate legacy risk. Visualization methods are useful as well, including dashboards or scorecards (with debt trends per business unit), heatmaps, maturity scores, and trend lines. A heatmap, for example, can show where risk clusters across the enterprise, and a trend line can reveal whether controls are improving or fading. The goal is to communicate findings clearly so that leaders can gain insights and act with confidence.
Leaders set the tone of an enterprise, and culture shifts when executives treat security debt as a shared business risk. This overall mindset change leads to fewer repeat findings, faster remediation, and stronger collaboration.
The Future of Security Debt
Security debt will always exist, but its future depends on how organizations manage it. As technology evolves, so does the nature of security debt itself.
Artificial Intelligence
AI has the potential to transform how organizations track and reduce security debt. Automated discovery tools can map unpatched systems, expired certificates, or policy gaps in minutes. Predictive analytics can flag areas where controls are most likely to fail, giving teams the foresight to act before incidents occur. But if left unmonitored, AI can create new blind spots or amplify poor decisions made without human oversight.24 The key is to pair AI’s speed with governance to ensure it strengthens, rather than undermines, resilience.
Board and Regulatory Pressure
Governance and disclosure expectations related to cyberrisk are growing stronger. New requirements, such as the US Securities and Exchange Commission’s (SEC’s) cybersecurity disclosure rule, require boards to evaluate and report cyberrisk with the same rigor as financial performance.25 In some cases, boards must attest that appropriate oversight exists. This forces organizations to quantify what was once intangible: security debt.
Risk and Performance Reporting
Evolutions in oversight are changing how organizations talk about risk. Data that was once buried in security reports is now reaching senior leadership and investors, driving more discussions about readiness and accountability. In the future, these conversations could evolve into formal reporting on security debt.
Conclusion
Security debt is not a new problem. What makes it different now is visibility. Organizational practices create security debt, but drivers such as innovation, cloud, AI, and speed might provide the tools to measure and reduce it.
The path forward begins with recognition. Organizations must first identify where the debt exists, then prioritize it based on business impact and risk exposure, not just technical severity. From there, progress depends on embedding accountability into culture, governance, and reporting. Security debt must be tracked, discussed, and managed like any other business liability.
The goal is awareness and adaptability. Leaders must understand that debt compounds and that reduction is a continuous process. The organizations that make real progress will be those that stay intentional by acknowledging debt, measuring it honestly, and taking consistent steps to reduce it. Every effort to improve visibility, strengthen governance, and align decisions to business goals brings an organization closer to sustainable resilience.